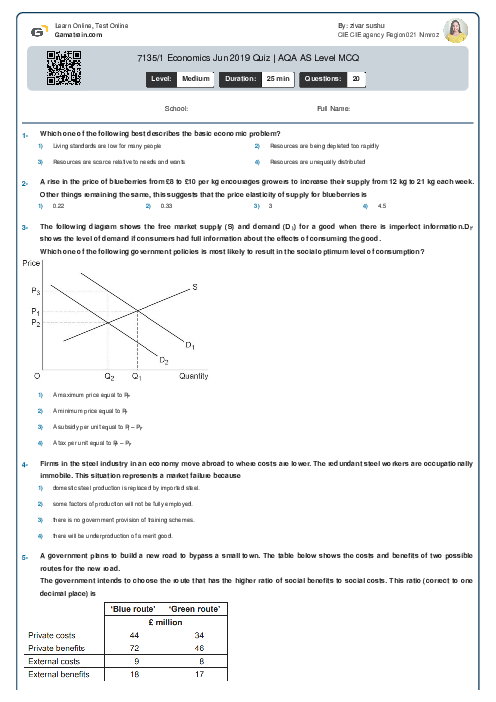
7135/1 Economics Jun 2019 Quiz | AQA AS Level MCQ
AQA
AS Level
Economics (7135)
شهریور
2019
مشاهده نمونه سوال
شامل مباحث:
تعداد سوالات: 20
سطح دشواری:
متوسط
شروع:
آزاد
پایان:
آزاد
مدت پاسخگویی:
25 دقیقه
پیش نمایش صفحه اول فایل
A government reduces its budget deficit. Other things remaining the same, the most likely short-run impact of this policy is


پرسش و پاسخ های مشابه
سوال کنید یا به سوالات دیگران پاسخ دهید ...