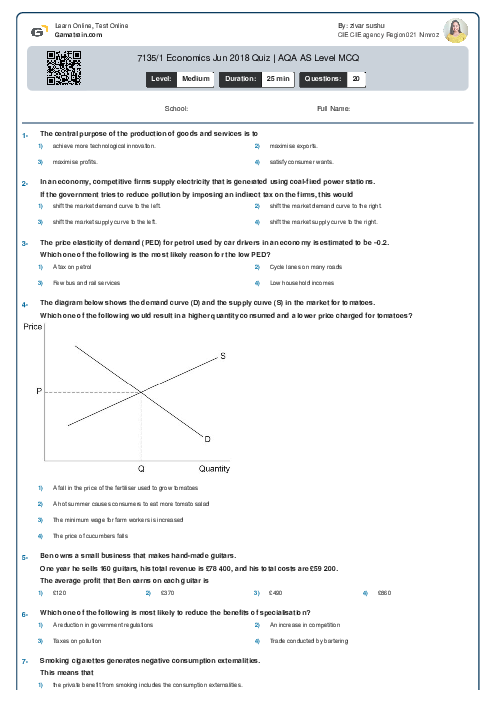
7135/1 Economics Jun 2018 Quiz | AQA AS Level MCQ
AQA
AS Level
Economics (7135)
شهریور
2018
مشاهده نمونه سوال
شامل مباحث:
تعداد سوالات: 20
سطح دشواری:
متوسط
شروع:
آزاد
پایان:
آزاد
مدت پاسخگویی:
25 دقیقه
پیش نمایش صفحه اول فایل
The annual rate of change in the consumer prices index for an economy falls from 6% to 3%. All other things being equal, this economy is best described as


پرسش و پاسخ های مشابه
سوال کنید یا به سوالات دیگران پاسخ دهید ...