
7135/2 Economics Jun 2020 Quiz | AQA AS Level MCQ
AQA
AS Level
Economics (7135)
شهریور
2020
مشاهده نمونه سوال
شامل مباحث:
تعداد سوالات: 20
سطح دشواری:
متوسط
شروع:
آزاد
پایان:
آزاد
مدت پاسخگویی:
25 دقیقه
پیش نمایش صفحه اول فایل
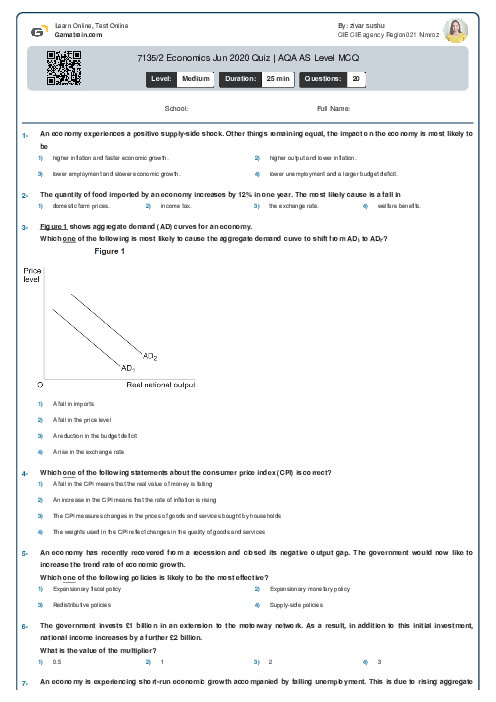
The diagram below shows the aggregate demand curves (AD) and short-run aggregate supply curves (SRAS) for an economy.
Which one of the following combinations of events is most likely to have caused the shift from A$D_1$ to AD$_2$ and the shift from SRAS$_1$ to SRAS$_2$?


پرسش و پاسخ های مشابه
سوال کنید یا به سوالات دیگران پاسخ دهید ...