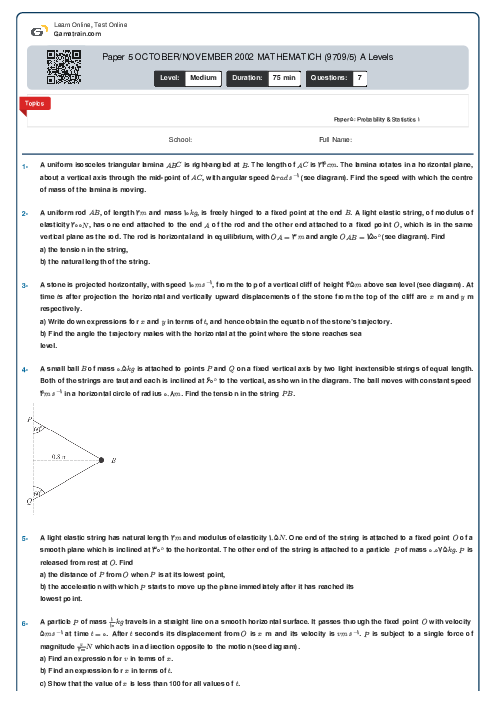
Paper 5 OCTOBER/NOVEMBER 2002 MATHEMATICH (9709/5) A Levels
Cambridge
AS & A Level
Mathematics (9709)
بهمن
2002
شامل مباحث:
Paper 5: Probability & Statistics 1
تعداد سوالات: 7
سطح دشواری:
متوسط
شروع:
آزاد
پایان:
آزاد
مدت پاسخگویی:
75 دقیقه
رایگان
لطفا برای اطمینان از عملکرد و تجربه بهتر از مرورگرهای مدرن و به روز مانند کروم یا فایرفاکس استفاده کنید.
پیش نمایش صفحه اول فایل
 Danial Naderi
 The lengths, in centimetres, of drinking straws produced in a factory have a normal distribution with mean $\mu $ and variance 0.64. It is given that 10% of the straws are shorter than $20{\text{ }}cm$.
a) Find the value of $\mu $.
b) Find the probability that, of 4 straws chosen at random, fewer than 2 will have a length between $21.5{\text{ }}cm$ and $22.5{\text{ }}cm$.


محتواهای آموزشی مشابه
فایل های پاورپوینت، ویدئو، صوتی، متنی و ...
پرسش و پاسخ های مشابه
سوال کنید یا به سوالات دیگران پاسخ دهید ...