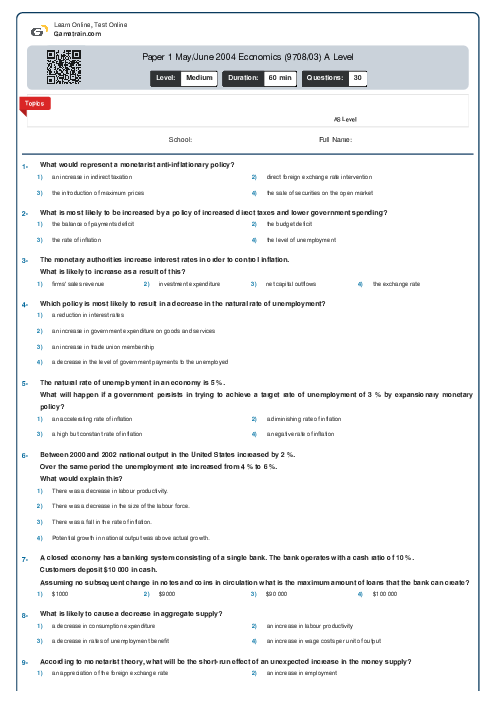
Paper 1 May/June 2004 Economics (9708/03) A Level
Cambridge
AS & A Level
Economics (9708)
شهریور
2004
شامل مباحث:
AS Level
تعداد سوالات: 30
سطح دشواری:
متوسط
شروع:
آزاد
پایان:
آزاد
مدت پاسخگویی:
60 دقیقه
پیش نمایش صفحه اول فایل
 Arefe Naderlouei
 A given production process uses both labour and capital.
What will be the effect on the quantities of labour and capital employed if the government introduces a subsidy on capital investment?


پرسش و پاسخ های مشابه
سوال کنید یا به سوالات دیگران پاسخ دهید ...