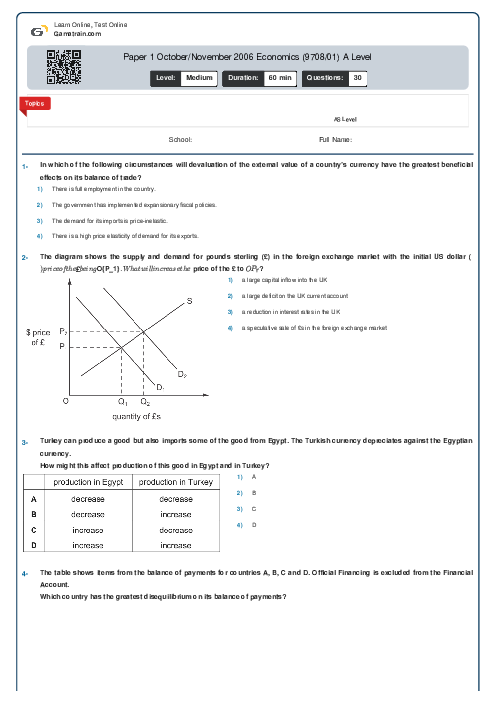
Paper 1 October/November 2006 Economics (9708/01) A Level
Cambridge
AS & A Level
Economics (9708)
بهمن
2006
مشاهده نمونه سوال
شامل مباحث:
AS Level
تعداد سوالات: 30
سطح دشواری:
متوسط
شروع:
آزاد
پایان:
آزاد
مدت پاسخگویی:
60 دقیقه
پیش نمایش صفحه اول فایل
 Arefe Naderlouei
 All else remaining unchanged, which measure would be most likely to increase the natural rate of unemployment?


پرسش و پاسخ های مشابه
سوال کنید یا به سوالات دیگران پاسخ دهید ...