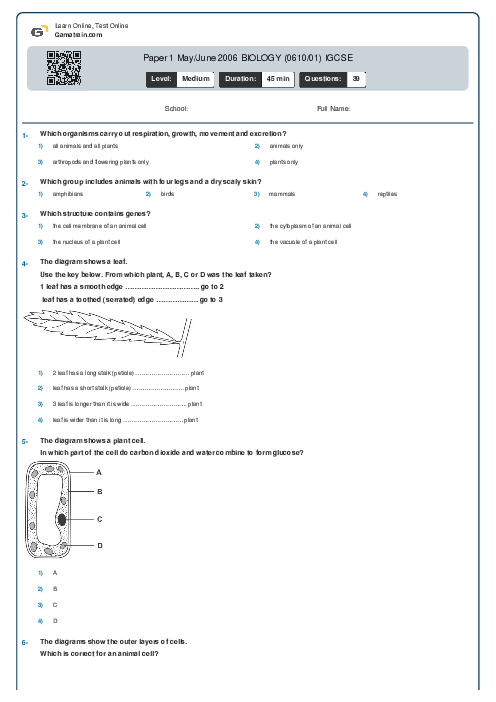
Paper 1 May/June 2006 BIOLOGY (0610/01) IGCSE
Cambridge
IGCSE
Biology (0610)
شهریور
2006
مشاهده نمونه سوال
شامل مباحث:
تعداد سوالات: 39
سطح دشواری:
متوسط
شروع:
آزاد
پایان:
آزاد
مدت پاسخگویی:
45 دقیقه
پیش نمایش صفحه اول فایل
 Danial Naderi

پرسش و پاسخ های مشابه
سوال کنید یا به سوالات دیگران پاسخ دهید ...