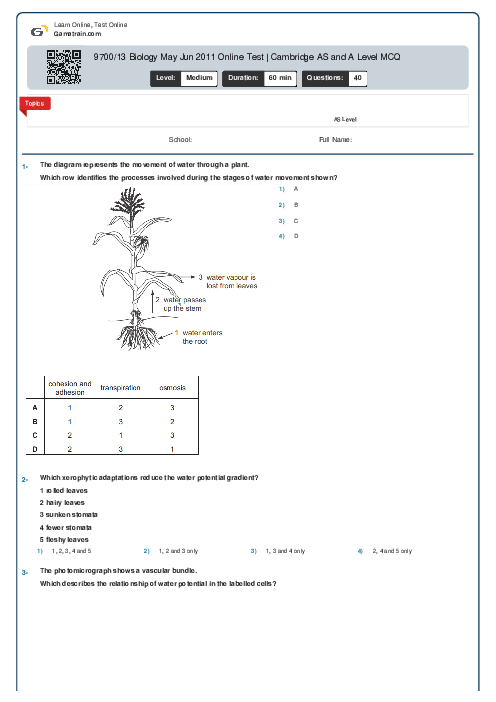
9700/13 Biology May Jun 2011 Online Test | Cambridge AS and A Level MCQ
Cambridge
AS & A Level
Biology (9700)
شهریور
2011
مشاهده نمونه سوال
شامل مباحث:
AS Level
تعداد سوالات: 40
سطح دشواری:
متوسط
شروع:
آزاد
پایان:
آزاد
مدت پاسخگویی:
60 دقیقه
پیش نمایش صفحه اول فایل
 Neda Bani
 An eyepiece graticule has a scale with 100 divisions. A stage micrometer has a scale with 50 divisions, each of which is 0.040mm apart.
Using a $ \times 40$ objective lens, the whole length of this stage micrometer scale lines up with 15 divisions of the eyepiece graticule.
What is the actual length of the 100 division scale of the eyepiece graticule?


پرسش و پاسخ های مشابه
سوال کنید یا به سوالات دیگران پاسخ دهید ...