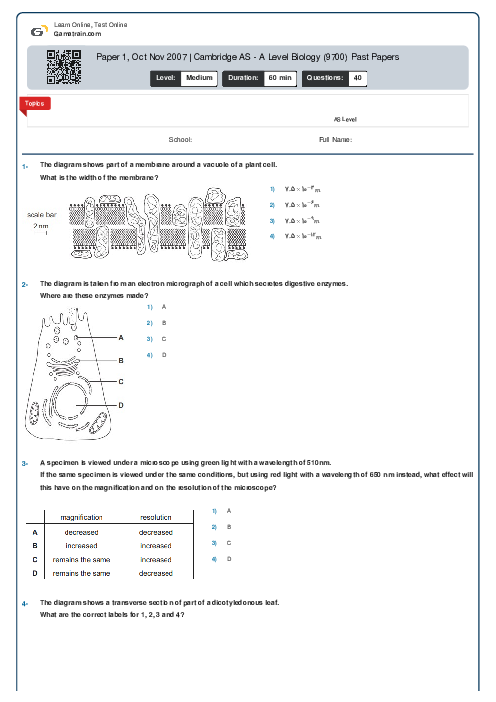
Paper 1, Oct Nov 2007 | Cambridge AS - A Level Biology (9700) Past Papers
Cambridge
AS & A Level
Biology (9700)
بهمن
2007
مشاهده نمونه سوال
شامل مباحث:
AS Level
تعداد سوالات: 40
سطح دشواری:
متوسط
شروع:
آزاد
پایان:
آزاد
مدت پاسخگویی:
60 دقیقه
پیش نمایش صفحه اول فایل
 Neda Bani
 The graph shows the oxygen dissociation curves of adult haemoglobin at two partial pressures of carbon dioxide W and X.
Which pair of statements are correct?
1 Curve W shows the oxygen dissociation curve at a higher concentration of carbon dioxide than curve X.
2 Curve X shows the oxygen dissociation curve at a higher concentration of carbon dioxide than curve W.
3 At a partial pressure of oxygen of 7.0 kPa the haemoglobin…


پرسش و پاسخ های مشابه
سوال کنید یا به سوالات دیگران پاسخ دهید ...