Paper 1, Oct Nov 2006 | Cambridge AS - A Level Biology (9700) Past Papers
Cambridge
AS & A Level
Biology (9700)
بهمن
2006
مشاهده نمونه سوال
شامل مباحث:
AS Level
تعداد سوالات: 40
سطح دشواری:
متوسط
شروع:
آزاد
پایان:
آزاد
مدت پاسخگویی:
60 دقیقه
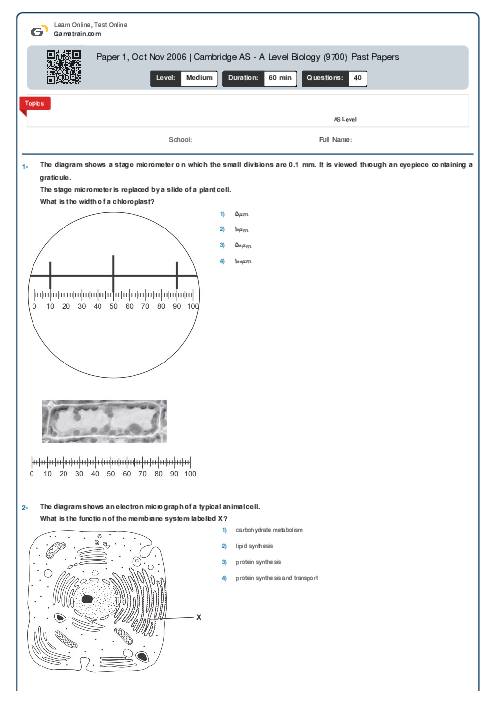
پیش نمایش صفحه اول فایل
Which description is correct for B-lymphocytes?


