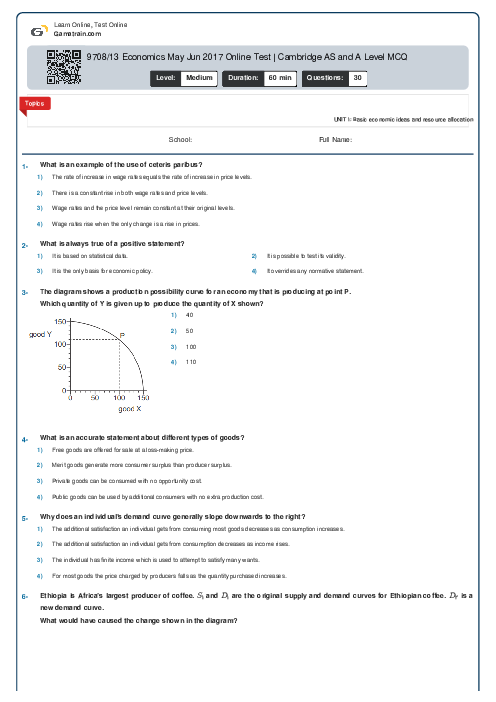
9708/13 Economics May Jun 2017 Online Test | Cambridge AS and A Level MCQ
Cambridge
AS & A Level
Economics (9708)
شهریور
2017
مشاهده نمونه سوال
شامل مباحث:
UNIT 1: Basic economic ideas and resource allocation
تعداد سوالات: 30
سطح دشواری:
متوسط
شروع:
آزاد
پایان:
آزاد
مدت پاسخگویی:
60 دقیقه
پیش نمایش صفحه اول فایل
 Neda Bani
 What is the opportunity cost to an unemployed worker who becomes employed?


پرسش و پاسخ های مشابه
سوال کنید یا به سوالات دیگران پاسخ دهید ...