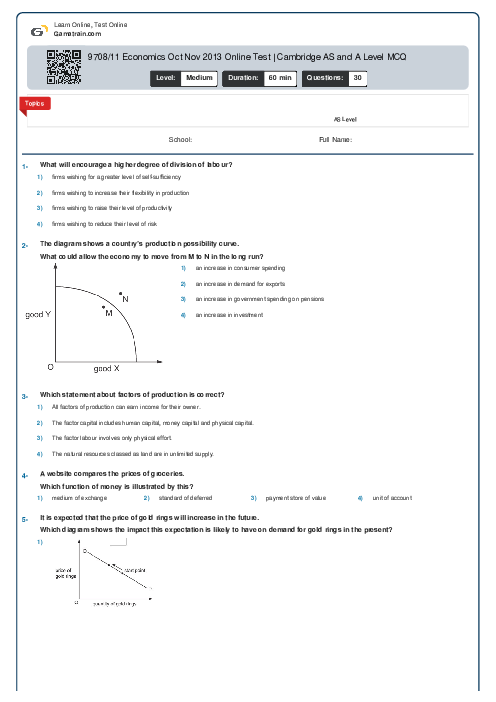
9708/11 Economics Oct Nov 2013 Online Test | Cambridge AS and A Level MCQ
Cambridge
AS & A Level
Economics (9708)
بهمن
2013
مشاهده نمونه سوال
شامل مباحث:
AS Level
تعداد سوالات: 30
سطح دشواری:
متوسط
شروع:
آزاد
پایان:
آزاد
مدت پاسخگویی:
60 دقیقه
پیش نمایش صفحه اول فایل
 Arefe Naderlouei
 What is an external cost of building new houses in a city centre?


پرسش و پاسخ های مشابه
سوال کنید یا به سوالات دیگران پاسخ دهید ...