0652/11 Physical Science Oct Nov 2020 Online Test | Cambridge IGCSE MCQ
Cambridge
IGCSE
Physical Science (0652)
بهمن
2020
شامل مباحث:
تعداد سوالات: 40
سطح دشواری:
متوسط
شروع:
آزاد
پایان:
آزاد
مدت پاسخگویی:
45 دقیقه
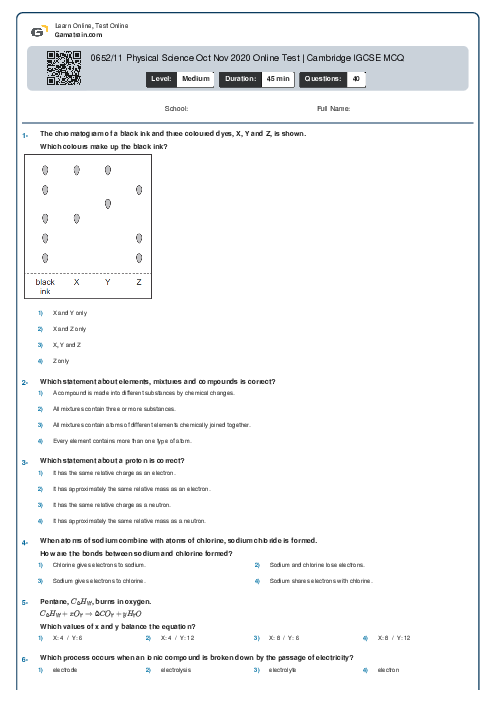
پیش نمایش صفحه اول فایل
Two atoms are different isotopes of the same element.
Which statement about these atoms is correct?


