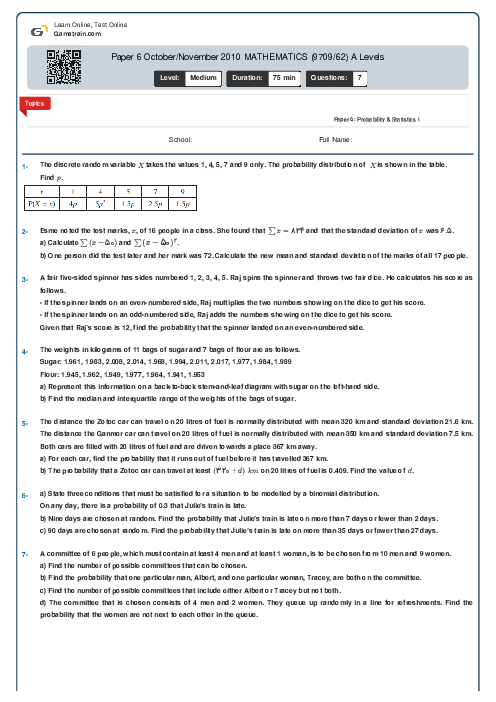
Paper 6 October/November 2010 MATHEMATICS (9709/62) A Levels
Cambridge
AS & A Level
Mathematics (9709)
بهمن
2010
شامل مباحث:
Paper 5: Probability & Statistics 1
تعداد سوالات: 7
سطح دشواری:
متوسط
شروع:
آزاد
پایان:
آزاد
مدت پاسخگویی:
75 دقیقه
رایگان
لطفا برای اطمینان از عملکرد و تجربه بهتر از مرورگرهای مدرن و به روز مانند کروم یا فایرفاکس استفاده کنید.
پیش نمایش صفحه اول فایل
 Danial Naderi
 A factory makes a large number of ropes with lengths either $3{\text{ }}m$ or $5{\text{ }}m$. There are four times as many ropes of length $3{\text{ }}m$ as there are ropes of length $5{\text{ }}m$.
a) One rope is chosen at random. Find the expectation and variance of its length.
b) Two ropes are chosen at random. Find the probability that they have different lengths.
Three ropes are chosen at random. Find the probability that their…

محتواهای آموزشی مشابه
فایل های پاورپوینت، ویدئو، صوتی، متنی و ...
پرسش و پاسخ های مشابه
سوال کنید یا به سوالات دیگران پاسخ دهید ...