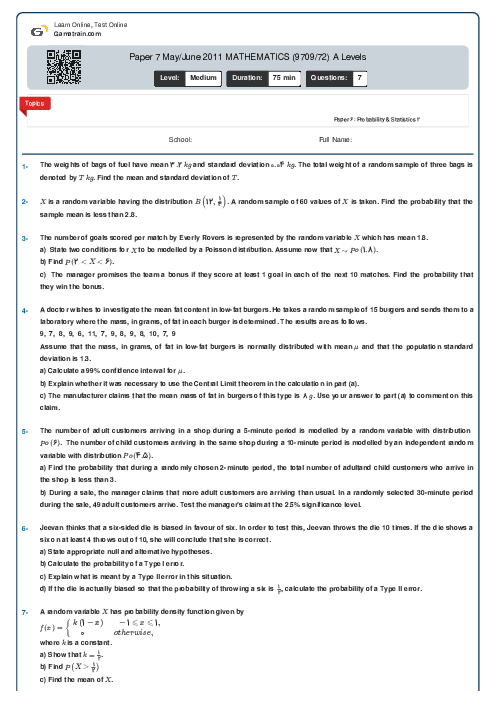
Paper 7 May/June 2011 MATHEMATICS (9709/72) A Levels
Cambridge
AS & A Level
Mathematics (9709)
شهریور
2011
شامل مباحث:
Paper 6: Probability & Statistics 2
تعداد سوالات: 7
سطح دشواری:
متوسط
شروع:
آزاد
پایان:
آزاد
مدت پاسخگویی:
75 دقیقه
رایگان
لطفا برای اطمینان از عملکرد و تجربه بهتر از مرورگرهای مدرن و به روز مانند کروم یا فایرفاکس استفاده کنید.
پیش نمایش صفحه اول فایل
 Danial Naderi
 Previous records have shown that the number of cars entering Bampor on any day has mean 352 and variance 121.
a) Find the probability that the mean number of cars entering Bampor during a random sample of 200 days is more than 354.
b) State, with a reason, whether it was necessary to assume that the number of cars entering Bampor on any day has a normal distribution in order to find the probability in part (a).
c) It is thought that…


محتواهای آموزشی مشابه
فایل های پاورپوینت، ویدئو، صوتی، متنی و ...
پرسش و پاسخ های مشابه
سوال کنید یا به سوالات دیگران پاسخ دهید ...