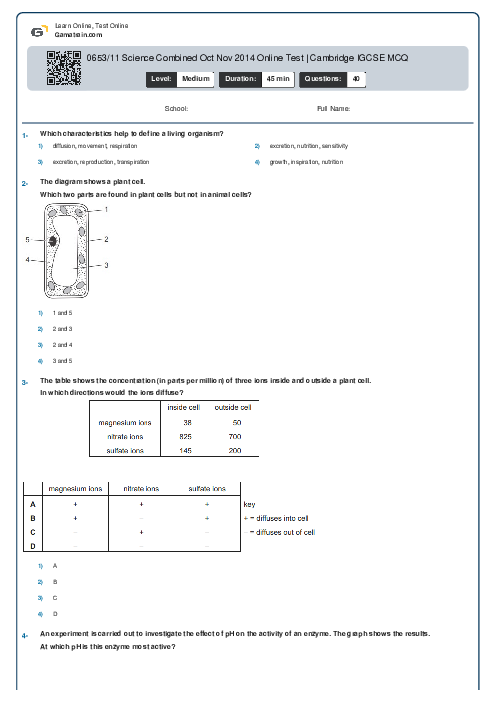
0653/11 Science Combined Oct Nov 2014 Online Test | Cambridge IGCSE MCQ
Cambridge
IGCSE
Science Combined (0653)
بهمن
2014
مشاهده نمونه سوال
شامل مباحث:
تعداد سوالات: 40
سطح دشواری:
متوسط
شروع:
آزاد
پایان:
آزاد
مدت پاسخگویی:
45 دقیقه
پیش نمایش صفحه اول فایل
 Arefe Naderlouei


پرسش و پاسخ های مشابه
سوال کنید یا به سوالات دیگران پاسخ دهید ...