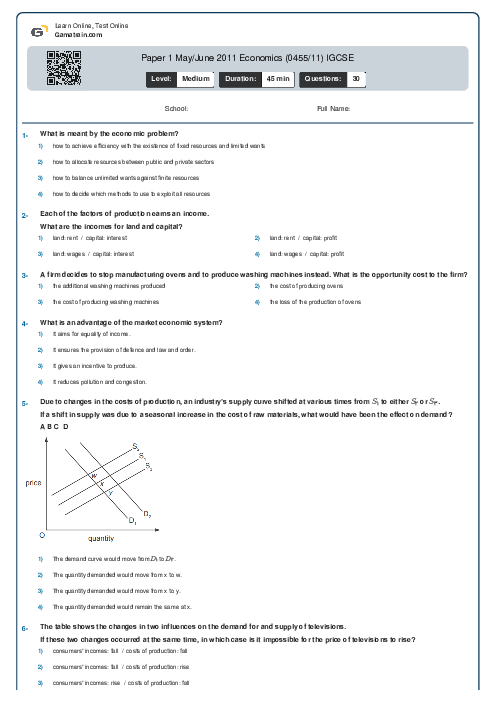
Paper 1 May/June 2011 Economics (0455/11) IGCSE
Cambridge
IGCSE
Economics (0455)
شهریور
2011
شامل مباحث:
تعداد سوالات: 30
سطح دشواری:
متوسط
شروع:
آزاد
پایان:
آزاد
مدت پاسخگویی:
45 دقیقه
پیش نمایش صفحه اول فایل
 Arefe Naderlouei
ثبت شده در
10 دی 1401
The graph shows government revenue and spending in a country, as a percentage of GDP, between 2004 and 2011.
What can be concluded from the graph?


پرسش و پاسخ های مشابه
سوال کنید یا به سوالات دیگران پاسخ دهید ...