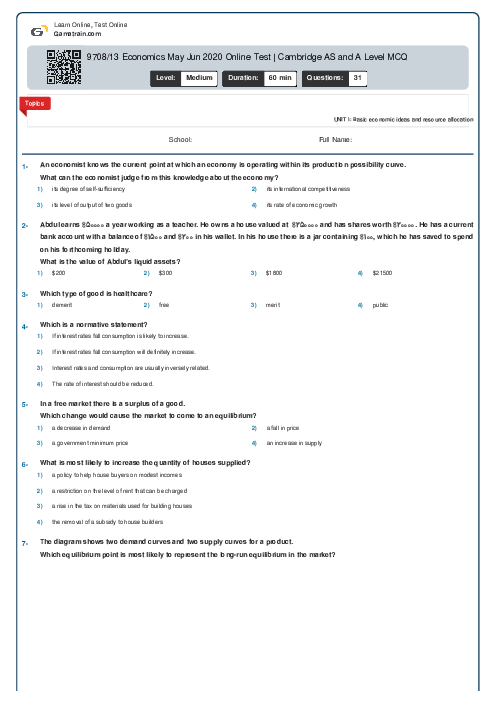
9708/13 Economics May Jun 2020 Online Test | Cambridge AS and A Level MCQ
Cambridge
AS & A Level
Economics (9708)
شهریور
2020
مشاهده نمونه سوال
شامل مباحث:
UNIT 1: Basic economic ideas and resource allocation
تعداد سوالات: 31
سطح دشواری:
متوسط
شروع:
آزاد
پایان:
آزاد
مدت پاسخگویی:
60 دقیقه
پیش نمایش صفحه اول فایل
 Neda Bani
 A country with a fixed exchange rate has a current account surplus on its balance of payments.
What is most likely to reduce this surplus?


پرسش و پاسخ های مشابه
سوال کنید یا به سوالات دیگران پاسخ دهید ...