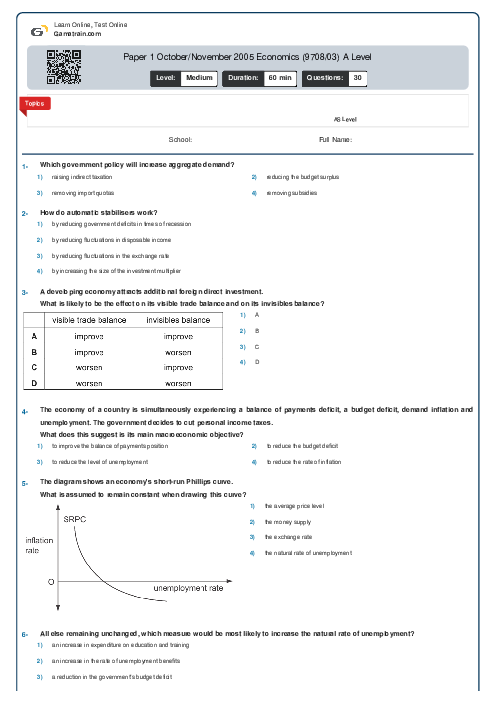
Paper 1 October/November 2005 Economics (9708/03) A Level
Cambridge
AS & A Level
Economics (9708)
بهمن
2005
شامل مباحث:
AS Level
تعداد سوالات: 30
سطح دشواری:
متوسط
شروع:
آزاد
پایان:
آزاد
مدت پاسخگویی:
60 دقیقه
پیش نمایش صفحه اول فایل
 Arefe Naderlouei
 The diagram shows how the quantity demanded of four goods changes as income changes.
Which good has an income elasticity of demand which is always +1?


پرسش و پاسخ های مشابه
سوال کنید یا به سوالات دیگران پاسخ دهید ...