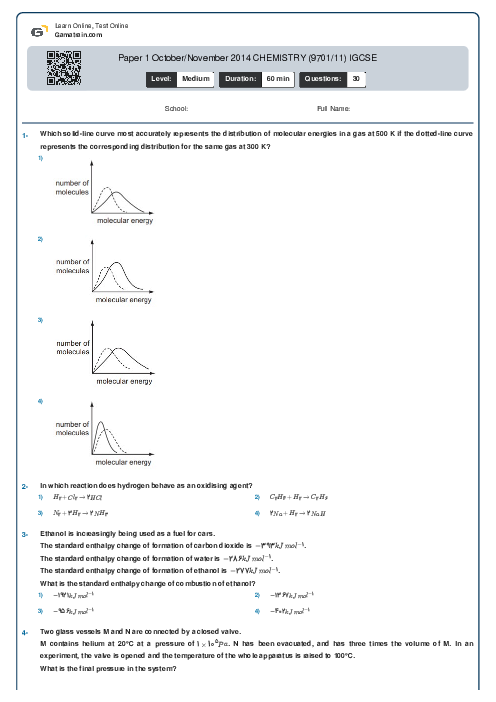
Paper 1 October/November 2014 CHEMISTRY (9701/11) IGCSE
Cambridge
AS & A Level
Chemistry (9701)
بهمن
2014
شامل مباحث:
تعداد سوالات: 30
سطح دشواری:
متوسط
شروع:
آزاد
پایان:
آزاد
مدت پاسخگویی:
60 دقیقه
پیش نمایش صفحه اول فایل
 Danial Naderi
ثبت شده در
29 دی 1401
Chlorine reacts with sodium bromide.
$\frac{1}{2}$Cl$_2$ + NaBr $\to$ NaCl + $\frac{1}{2}$Br$_2$
Which words correctly describe this reaction?
1- redox
2- displacement
3- disproportionation

پرسش و پاسخ های مشابه
سوال کنید یا به سوالات دیگران پاسخ دهید ...