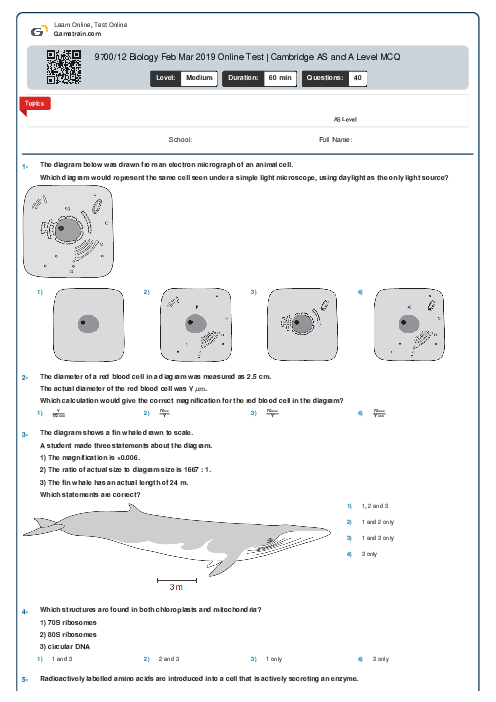
9700/12 Biology Feb Mar 2019 Online Test | Cambridge AS and A Level MCQ
Cambridge
AS & A Level
Biology (9700)
خرداد
2019
مشاهده نمونه سوال
شامل مباحث:
AS Level
تعداد سوالات: 40
سطح دشواری:
متوسط
شروع:
آزاد
پایان:
آزاد
مدت پاسخگویی:
60 دقیقه
پیش نمایش صفحه اول فایل
 Gama Admin
 After an immune response, memory cells remain in the blood for a long time.
What is the function of memory cells?


پرسش و پاسخ های مشابه
سوال کنید یا به سوالات دیگران پاسخ دهید ...