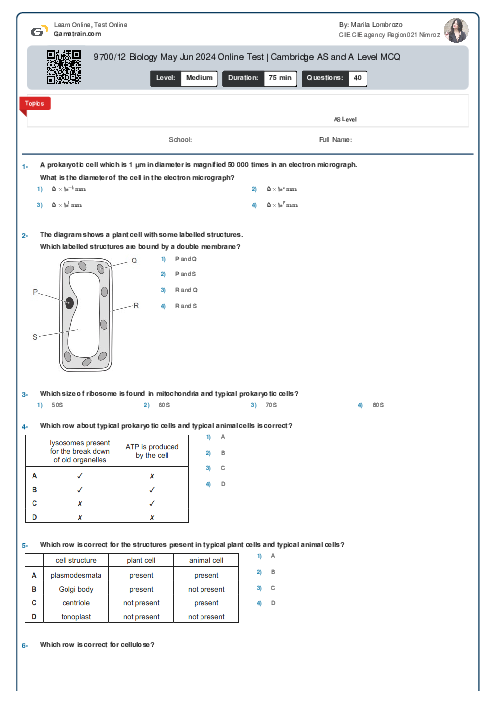
9700/12 Biology May Jun 2024 Online Test | Cambridge AS and A Level MCQ
Cambridge
AS & A Level
Biology (9700)
شهریور
2024
مشاهده نمونه سوال
شامل مباحث:
AS Level
تعداد سوالات: 40
سطح دشواری:
متوسط
شروع:
آزاد
پایان:
آزاد
مدت پاسخگویی:
75 دقیقه
پیش نمایش صفحه اول فایل
A country has fewer than 2.5 deaths per 100000 people from TB in one year and the next year this rose to 25 deaths per 100000.
What may have contributed to this change?
1 decrease in contact tracing
2 increase in refugee camps
3 water supply contaminated by sewage


پرسش و پاسخ های مشابه
سوال کنید یا به سوالات دیگران پاسخ دهید ...