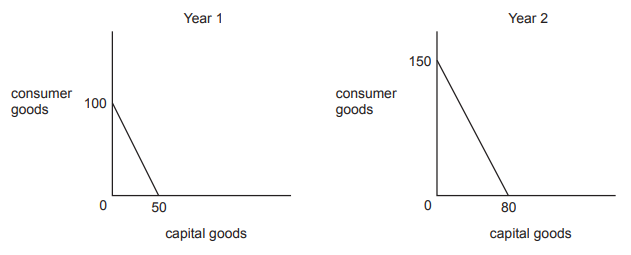
The diagrams show the change in a country’s production possibility curve between Year 1 and Year 2.
What can be deduced from the diagrams?
1 )
Future growth prospects have been harmed.
2 )
The level of unemployment has fallen.
The opportunity cost of consumer goods has risen.
4 )
The proportionate growth in production is greater in consumer goods.
تحلیل ویدئویی تست
منتظریم اولین نفر تحلیلش کنه!


پرسش و پاسخ های مشابه
سوال کنید یا به سوالات دیگران پاسخ دهید ...