The graph shows changes in the antibiotic resistance of a species of bacterium between 2000 and 2016 in one country. Samples of bacteria were collected every year from 48 hospitals. The bacteria were tested to see if they showed resistance to five different antibiotics.
What can be concluded from the data in the graph?
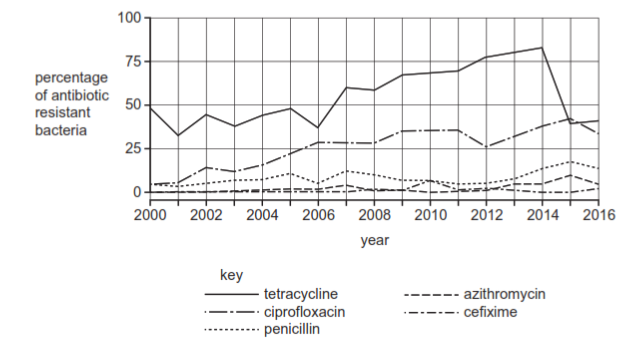
1 )
Overuse of ciprofloxacin has caused antibiotic resistance to increase by more than $\20%$ between 2000 and 2016.
Percentage resistance to three of the antibiotics was at a peak in 2015.
3 )
Changes in treatment guidelines have caused resistance to some antibiotics to decrease from 2015 to 2016.
4 )
The percentage of resistant bacteria is higher in 2016 than 2000 for all antibiotics.
تحلیل ویدئویی تست
منتظریم اولین نفر تحلیلش کنه!


پرسش و پاسخ های مشابه
سوال کنید یا به سوالات دیگران پاسخ دهید ...