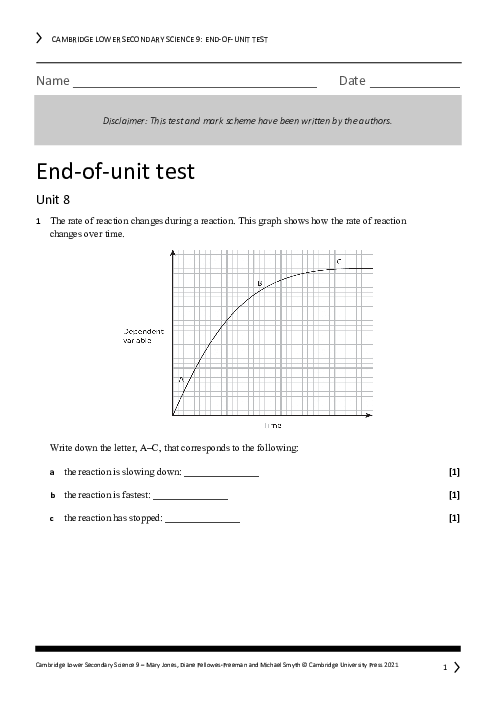
In a graph showing the volume of gas produced against time for a reaction, an anomalous result would most likely be identified as:
1 )
A point that lies exactly on the curve of best fit
2 )
A point that shows a higher volume of gas than all other points
A point that deviates significantly from the general pattern of other data points
4 )
The final point where no more gas is being produced
تحلیل ویدئویی تست
منتظریم اولین نفر تحلیلش کنه!


پرسش و پاسخ های مشابه
سوال کنید یا به سوالات دیگران پاسخ دهید ...