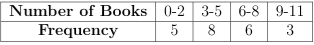
The frequency table below shows the number of books read by students in a class. Which graph type is most appropriate to represent this data?
1 )
Line graph
Bar graph
3 )
Pie chart
4 )
Scatter plot
تحلیل ویدئویی تست
منتظریم اولین نفر تحلیلش کنه!