The diagram shows the average earnings per hour of postal workers between 1999 and 2001.
Which of the following could explain the above diagram?
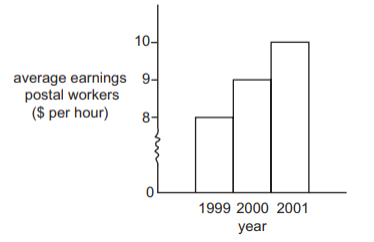
1 )
a reduction in trade union membership
the introduction of more efficient work practices
3 )
the employment of more part-time workers
4 )
an increase in the number of hours worked
تحلیل ویدئویی تست
تحلیل ویدئویی برای این تست ثبت نشده است!


پرسش و پاسخ های مشابه
سوال کنید یا به سوالات دیگران پاسخ دهید ...