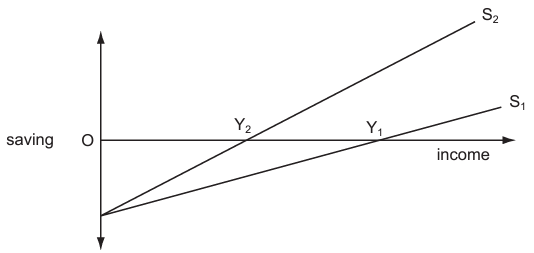
The diagram shows a shift in the economy's saving function from ${S_1}$ to ${S_2}$.
What can be deduced from the diagram?
1 )
The multiplier has increased.
The marginal propensity to save has increased.
3 )
Autonomous consumption has increased.
4 )
Equilibrium national income has fallen from $O{Y_1}$ to $O{Y_2}$.
تحلیل ویدئویی تست
منتظریم اولین نفر تحلیلش کنه!


