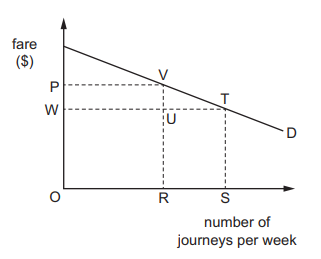
The number of passenger journeys per week by train on a route is shown by the demand curve in the diagram.
Initially the fare is OP, but it is then reduced by PW.
Which area measures the amount spent on the extra journeys resulting from the lower fare?
1 )
VUT
2 )
PWTV
3 )
VRST
URST
تحلیل ویدئویی تست
منتظریم اولین نفر تحلیلش کنه!