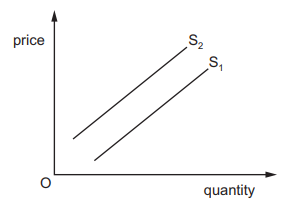
The diagram shows a shift in a firm’s supply curve from ${S_1}$ to ${S_2}$.
What may have caused the shift from ${S_1}$ to ${S_2}$?
1 )
a decrease in the costs of production of the firm
2 )
a decrease in the popularity of the firm’s product
a decrease in the subsidy on the good
4 )
a decrease in the tax on the good
تحلیل ویدئویی تست
منتظریم اولین نفر تحلیلش کنه!


پرسش و پاسخ های مشابه
سوال کنید یا به سوالات دیگران پاسخ دهید ...