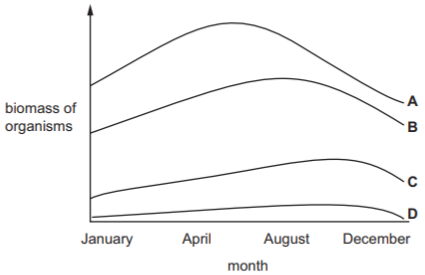
The graph shows changes in biomass of different organisms in an ecosystem over a 12 month period. Each line represents a different trophic level.
Which line represents the herbivores?
1 )
A
B
3 )
C
4 )
D
تحلیل ویدئویی تست
منتظریم اولین نفر تحلیلش کنه!


پرسش و پاسخ های مشابه
سوال کنید یا به سوالات دیگران پاسخ دهید ...