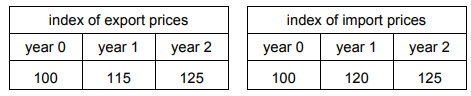
The tables show changes over a period in the average prices of a country’s exports and imports.
They are expressed as index numbers, with year 0 as 100.
What is the change in the country’s terms of trade index between years 1 and 2?
1 )
It improves by about 10%.
It improves between 4% and 5%.
3 )
It stays the same.
4 )
It worsens between 4% and 5%.
تحلیل ویدئویی تست
منتظریم اولین نفر تحلیلش کنه!


پرسش و پاسخ های مشابه
سوال کنید یا به سوالات دیگران پاسخ دهید ...