Some studies suggest that smoking increases the risk of developing lung cancer. The two graphs show the percentage of smokers and the deaths from lung cancer in men of two age groups between 1950 and 1998.
Which statement is not supported by the data in the graphs?
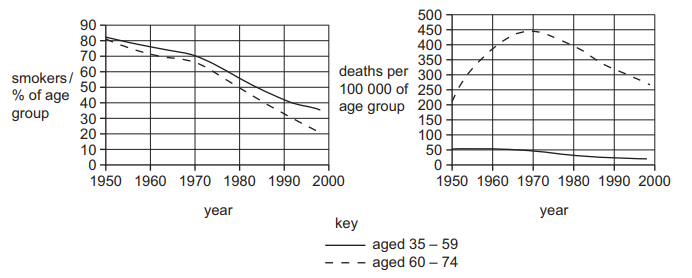
1 )
Deaths from lung cancer in men 35-59 decreased by 50% over the period of the study.
2 )
Deaths from lung cancer in men 60-74 increased up to 1970.
3 )
The data for men 60-74 between 1950 to 1970 suggests that lung cancer takes up to 20 years to develop.
The number of men aged 35-59 who were smokers decreased by approximately 60 % over the period of the study.
تحلیل ویدئویی تست
منتظریم اولین نفر تحلیلش کنه!


پرسش و پاسخ های مشابه
سوال کنید یا به سوالات دیگران پاسخ دهید ...