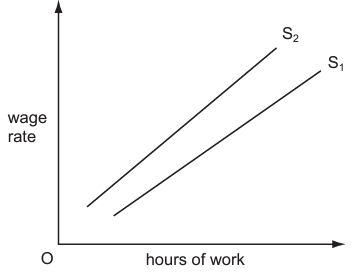
In the diagram ${S_1}$ is an individual worker's initial supply of labour curve.
What could cause the curve to shift to ${S_2}$?
1 )
an increase in the hourly wage rate
an increased preference for leisure
3 )
an increase in the opportunity cost of leisure
4 )
an increase in work satisfaction
تحلیل ویدئویی تست
تحلیل ویدئویی برای این تست ثبت نشده است!


پرسش و پاسخ های مشابه
سوال کنید یا به سوالات دیگران پاسخ دهید ...