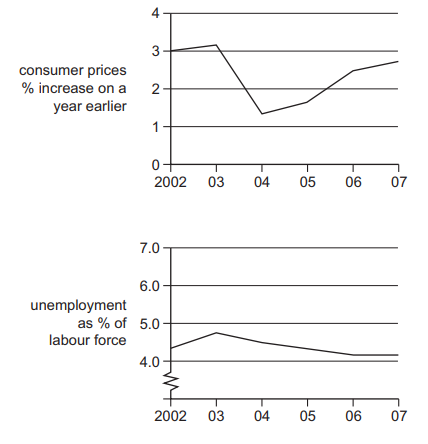
The graphs show consumer prices and employment for Ireland.
What can be concluded from the graphs?
1 )
Between 2003 and 2004, unemployment and prices moved in the same direction.
2 )
Prices were at their lowest in 2004.
Prices rose continuously over the period.
4 )
The number of unemployed workers fell over the period.
تحلیل ویدئویی تست
منتظریم اولین نفر تحلیلش کنه!


پرسش و پاسخ های مشابه
سوال کنید یا به سوالات دیگران پاسخ دهید ...