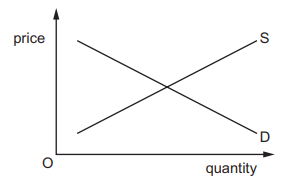
The diagram shows the market for a normal good.
What is likely to cause both demand and supply curves to shift to the right?
1 )
a fall in the price of the good and a fall in the rate of indirect tax on the good
2 )
a rise in the price of a complementary good and an increase in the number of firms in the industry
a rise in the price of a substitute good and a fall in the price of a raw material used in the production of the good
4 )
an improvement in production techniques and a fall in the incomes of consumers
تحلیل ویدئویی تست
منتظریم اولین نفر تحلیلش کنه!


پرسش و پاسخ های مشابه
سوال کنید یا به سوالات دیگران پاسخ دهید ...