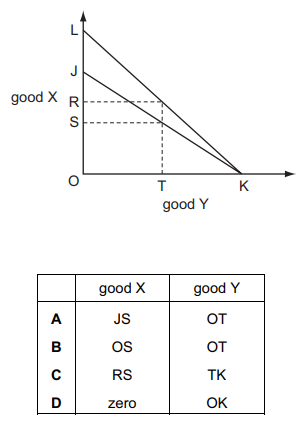
In the diagram, JK is a country’s production possibility curve. LK is its trading possibility curve which shows possible combinations of good X and good Y after specialising in the product in which it has comparative advantage, and then trading it.
The country consumes OR of good X and OT of good Y.
Which quantities of goods X and Y does it produce?
1 )
A
2 )
B
3 )
C
D
تحلیل ویدئویی تست
منتظریم اولین نفر تحلیلش کنه!


پرسش و پاسخ های مشابه
سوال کنید یا به سوالات دیگران پاسخ دهید ...