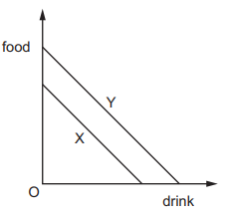
Countries X and Y have identical resources. The diagram shows their production possibility curves.
What can be concluded from the diagram?
1 )
X can produce food and drink more cheaply than Y.
2 )
X experiences higher unemployment than Y.
Y can produce food and drink more efficiently than X.
4 )
Y has higher retail prices than X.
تحلیل ویدئویی تست
منتظریم اولین نفر تحلیلش کنه!


پرسش و پاسخ های مشابه
سوال کنید یا به سوالات دیگران پاسخ دهید ...