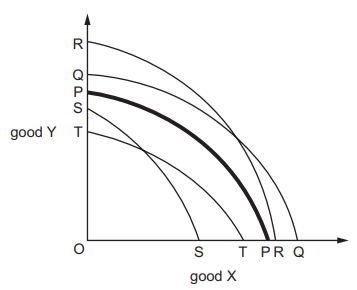
The curve PP in the diagram is the production possibility curve for a country producing goods X and Y. The production of X is more labour-intensive than the production of Y.
The working hours of the labour force are reduced by law.
Which curve could be the country’s new production possibility curve?
1 )
TT
SS
3 )
4 )
RR
تحلیل ویدئویی تست
منتظریم اولین نفر تحلیلش کنه!


