The graph shows changes in the body temperature of a person over a 60-hour period.
Which statement about the graph is correct?
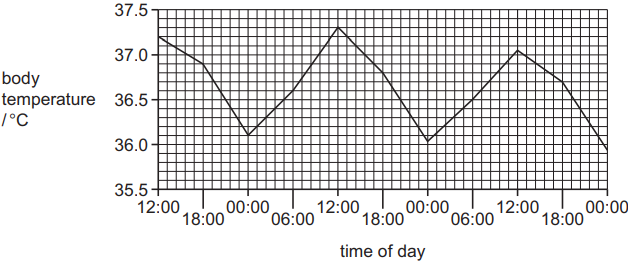
1 )
The temperature of the person is always lower at 18:00 than at 06:00.
2 )
The range shown by the data is 1.0$^\circ$C.
3 )
The temperature of the person after 9 hours from the start is 36.8$^\circ$C.
Over this period, the mean temperature of the person at 18:00 is 36.8$^\circ$C.
تحلیل ویدئویی تست
منتظریم اولین نفر تحلیلش کنه!


پرسش و پاسخ های مشابه
سوال کنید یا به سوالات دیگران پاسخ دهید ...