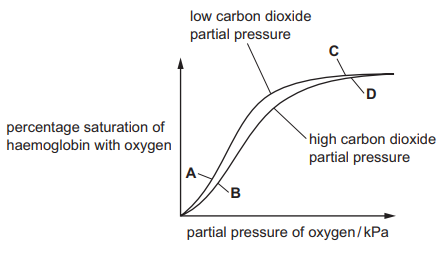
The graph shows the dissociation curves for haemoglobin at two different partial pressures of carbon dioxide.
At which position on the graph, A, B, C, or D, is the concentration of haemoglobinic acid lowest in red blood cells?
1 )
A
2 )
B
C
4 )
D
تحلیل ویدئویی تست
منتظریم اولین نفر تحلیلش کنه!