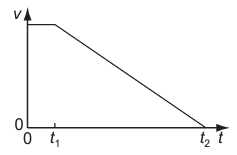
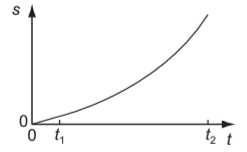
When a car driver sees a hazard ahead, she applies the brakes as soon as she can and brings the car to rest. The graph shows how the speed v of the car varies with time t after the hazard is seen.
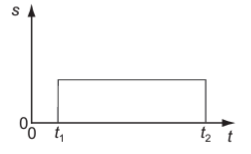
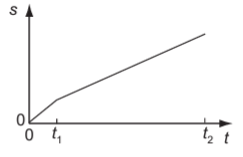
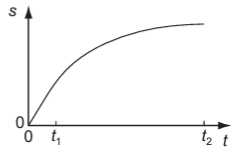
Which graph represents the variation with time t of the distance s travelled by the car after the hazard has been seen?
1 )
2 )
4 )
تحلیل ویدئویی تست
منتظریم اولین نفر تحلیلش کنه!


پرسش و پاسخ های مشابه
سوال کنید یا به سوالات دیگران پاسخ دهید ...