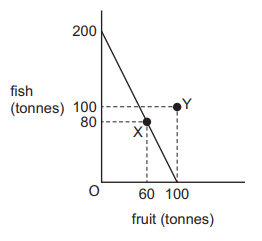
The production possibility curve shows island J’s ability to produce fish and fruit. It specialises entirely in fish in which it has a comparative advantage and trades fish for fruit from island K.
As a result, island J increases its consumption from 80 tonnes of fish and 60 tonnes of fruit, point X, to 100 tonnes of fish and 100 tonnes of fruit, point Y.
What was island J’s exchange rate of fish for fruit?
1 )
1 tonne of fish for $\frac{1}{2}$ tonne of fruit
2 )
1 tonne of fish for $\frac{3}{4}$ tonne of fruit
1 tonne of fish for 1 tonne of fruit
4 )
1 tonne of fish for 2 tonnes of fruit
تحلیل ویدئویی تست
منتظریم اولین نفر تحلیلش کنه!


پرسش و پاسخ های مشابه
سوال کنید یا به سوالات دیگران پاسخ دهید ...