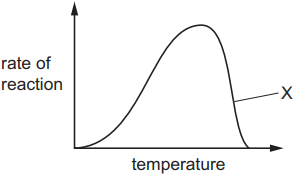
The diagram shows the effect of temperature on the rate of an enzyme-controlled reaction.
What is the explanation for the part of the graph labelled X?
1 )
The temperature is dropping.
2 )
The substrate is starting to run out.
The enzyme is becoming denatured.
4 )
The enzyme is starting to run out.
تحلیل ویدئویی تست
منتظریم اولین نفر تحلیلش کنه!