The diagram shows the effect on the market for rice of a change in government policy that causes a shift in the supply curve from ${S_1}$ to ${S_2}$.
What does the area JKLM represent?
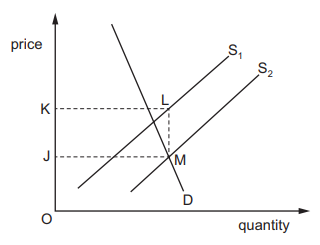
the cost to the government of a subsidy to rice growers
2 )
the extra saving to importers of the removal of a tariff on rice
3 )
the increase in consumer surplus from the introduction of a maximum price for rice
4 )
the loss in government revenue from the reduction in a lump sum tax on rice
تحلیل ویدئویی تست
منتظریم اولین نفر تحلیلش کنه!


پرسش و پاسخ های مشابه
سوال کنید یا به سوالات دیگران پاسخ دهید ...