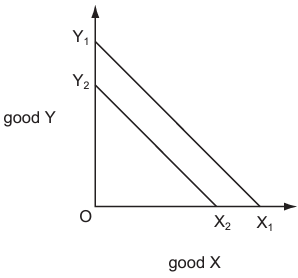
The diagram illustrates the production possibility curves for an economy in Year 1 $({X_1},{Y_1})$ and Year 2 $({X_2},{Y_2})$
What can be deduced from the diagram?
1 )
The cost of production was lower in Year 2 than in Year 1.
2 )
The full employment level of output was lower in Year 2 than in Year 1.
3 )
The opportunity cost was lower in Year 2 than in Year 1.
Unemployment rose between Year 1 and Year 2.
تحلیل ویدئویی تست
منتظریم اولین نفر تحلیلش کنه!


پرسش و پاسخ های مشابه
سوال کنید یا به سوالات دیگران پاسخ دهید ...