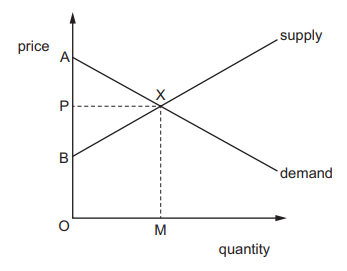
The diagram shows the demand and supply curves for a good during a certain period. The market price is shown by P and the quantity traded by point M.
Which area indicates producer surplus?
1 )
AXB
2 )
AXMO
3 )
AXP
PXB
تحلیل ویدئویی تست
منتظریم اولین نفر تحلیلش کنه!


