The diagram shows pressure changes in the aorta, left atrium and left ventricle during the cardiac cycle.
Which row explains the changes in the left ventricle at different times on the graph?
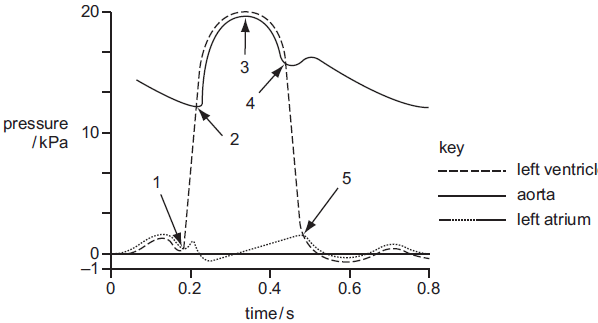
(region of graph) between 1 and 2 (muscles of ventricle wall) contract (volume of left ventricle) remains constant
2 )
(region of graph) between 2 and 3 (muscles of ventricle wall) relax (volume of left ventricle) increases
3 )
(region of graph) between 3 and 4 (muscles of ventricle wall) contract (volume of left ventricle) remains constant
4 )
(region of graph) between 4 and 5 (muscles of ventricle wall) relax (volume of left ventricle) decreases
تحلیل ویدئویی تست
منتظریم اولین نفر تحلیلش کنه!


پرسش و پاسخ های مشابه
سوال کنید یا به سوالات دیگران پاسخ دهید ...