The diagram shows the demand curve for good X.
What could cause a movement along the curve from M to N?
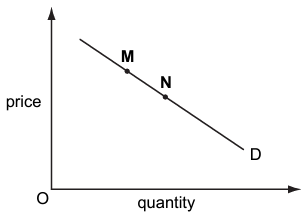
1 )
a change in consumer tastes in favour of X
a decrease in labour costs of producing X
3 )
a decrease in the demand for X
4 )
an increase in the price of a substitute good
تحلیل ویدئویی تست
منتظریم اولین نفر تحلیلش کنه!


پرسش و پاسخ های مشابه
سوال کنید یا به سوالات دیگران پاسخ دهید ...