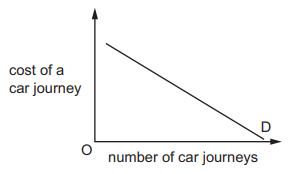
The demand curve in the diagram shows the relationship between the number of car journeys and the cost of a car journey.
What would cause the demand curve to shift to the left?
1 )
a reduction in car tax
2 )
a reduction in petrol prices
a reduction in public transport prices
4 )
the introduction of tolls on motorways
تحلیل ویدئویی تست
منتظریم اولین نفر تحلیلش کنه!


پرسش و پاسخ های مشابه
سوال کنید یا به سوالات دیگران پاسخ دهید ...